Product Qualified Leads: The Complete Guide for Modern SaaS Teams
November 28, 2025 • 19 min read

Last Updated on June 18, 2026 by Sivan Kadosh
Product qualified leads are one of the most misunderstood topics in product led growth. Most articles stay at the surface. They define the concept, give a few basic examples and move on.
This guide goes deeper. It shows you how to define PQLs for your specific business model, how to instrument the right data, and how to operationalize everything across product, marketing and sales. You will walk away with a clear, actionable framework you can use this week.
This article is written for founders, product leaders and growth teams who want to increase activation, improve trial to paid conversion and align teams around a shared definition of value.
Key takeaways
• A PQL is not a free user. It is a user who has experienced meaningful value that predicts conversion.
• Strong PQL definitions are built from fit signals and usage signals.
• The best PQLs are grounded in activation metrics and a clear path to value.
• Tracking PQLs requires clean event data, well defined onboarding funnels and cross functional alignment.
• Companies that implement a PQL process typically see higher conversion rates, lower CAC and shorter sales cycles.
• A fractional CPO can help define your PQL model, fix onboarding gaps and align your teams quickly.
What a product qualified lead is and why it matters
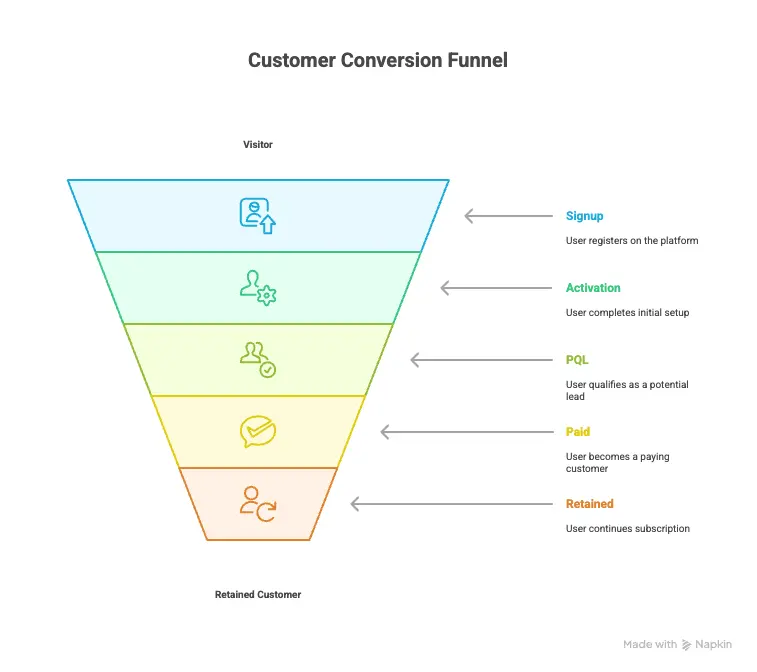
A product qualified lead is a user who has reached a point in the product where they experience meaningful value. In practical terms, they have performed the actions that strongly predict they will become a paying customer.
A PQL sits between activation and purchase. They are more valuable than an MQL because they have touched the product. They are more reliable than an SQL because the qualification is based on behaviour rather than assumptions or form fills.
How PQLs differ from MQLs and SQLs
Marketing-qualified leads (MQLs)
Marketing qualified leads are defined based on marketing interactions such as downloads, webinar signups or content engagement.
Sales-qualified leads (SQLs)
Sales qualified leads are defined based on demographic or firmographic fit plus sales discovery.
Product-qualified leads (PQLs)
Product qualified leads are defined based on behavioural signals that show value creation inside the product.
| Lead Type | How It Is Defined | Key Signals | Strengths | Limitations |
|---|---|---|---|---|
| MQL | Based on marketing interactions | Content downloads, webinar signups, email clicks, website engagement | Good for top of funnel volume and early interest | Does not reflect real product intent, often low conversion to paid |
| SQL | Based on demographic or firmographic fit | Company size, role, industry, budget, sales discovery inputs | Good for identifying ICP aligned prospects | Still based on assumptions rather than behaviour, limited accuracy in PLG motions |
| PQL | Based on actual behaviour inside the product | Activation event, depth of usage, feature adoption, collaboration actions | Strong indicator of genuine intent and value realised | Requires clean data, strong instrumentation and cross functional alignment |
Why PQLs are a major growth lever
Most SaaS companies struggle with the middle of the funnel. They bring people in through marketing, but only a small percentage convert because users never reach the moment where the product becomes useful.
PQLs solve this gap.
To truly grasp the devastating cost of ignoring this misalignment and failing to define PQLs, consider the following cautionary tale from our own experience:
A personal experience: The fatal cost of ignoring PQLs
The truth is, a lack of PQL understanding can simply kill your startup. I saw it happen firsthand. About a decade ago, I guided a client who had an excellent product and was achieving initial PMF. They were deep in the ‘Valley of Death.’ The CEO made a move that seemed necessary: he hired an experienced SDR to generate qualified leads. However, this SDR came from traditional sales and lacked deep SaaS expertise. He resorted to spraying and praying: cold emails, LinkedIn outreach, treating every signup the same as a cold prospect. In short, he was thrashing wildly, and the results never materialized.
The critical error: Quantity over quality
Months passed, the cash ran out, and pressure from the board began to mount. The real tragedy wasn’t a weak product, it was falling into the most common trap: focusing on lead quantity over quality. This is a fatal mistake in modern sales, as analyzed by Jeff Bullas. While the SDR was burning time on cold leads, dozens of users inside the product had already performed critical actions, experienced value, and were hot PQLs.
The uncounted metrics
The SDR ignored the core philosophy of SaaS growth. He treated PQLs merely as “free users,” failing to recognize the massive conversion gap. Studies have consistently shown that PQLs convert to paid customers at a rate 5 to 8 times higher than non-usage-based leads, according to Data-Mania. But because the company lacked a clear internal PQL definition, the gold was left untouched.
The end: Fatal misalignment
The ending was swift and painful. Customer Acquisition Cost (CAC) skyrocketed, Lifetime Value (LTV) remained low due to poor conversion quality, and the investors withdrew funding. The startup died not because of the market, but because of a failure in aligning sales and product around clear lead definitions. The importance of this cross-functional clarity is emphasized by Baremetrics. The lesson is clear: without a system that identifies intent directly from product usage, you are running a business blind.
This painful case study is a clear demonstration of why companies that successfully implement a rigorous PQL model gain predictable performance and avoid the critical pitfalls of manual, misaligned sales efforts, leading directly to the following fundamental improvements.
How PQLs improve performance
• Higher trial to paid conversion
• Better CAC efficiency
• More predictable funnel
• Sales can focus on leads with higher intent
• Product teams get clarity on what drives activation
Benchmarks you can use as a reference
While every product is unique, typical ranges in SaaS look like this:
• PQL rate often sits between 10 percent and 25 percent
• PQL to Paid conversion often ranges from 15 percent to 35 percent
• Companies that implement clear PQL definitions often see double digit improvements in conversion within one or two quarters
How to define PQLs for your product: a simple framework
A strong PQL definition is built from two ingredients: fit and behaviour.
• Fit tells you whether a user matches your ideal customer profile.
• Behaviour tells you whether they have reached meaningful value inside your product.
Both signals are important. A high fit user with shallow usage is not ready to buy. A heavy user with poor fit may convert, but often churns fast. The strongest PQLs score highly on both.
Below is a clear framework you can use to define your own PQL model, regardless of your business type.
Step 1. Identify key activation events
Activation is the moment a user first experiences real value. Until this happens, most signups are just warm leads. Once a user reaches activation, intent becomes measurable through behaviour.
The right activation event is different for every product. It should reflect your core value proposition.
Examples:
• A customer support tool might define activation as receiving and responding to the first ticket.
• A marketing automation product might define activation as sending the first automated campaign.
• A project management tool might define activation as creating the first project and inviting a collaborator.
• An API product might define activation as making a successful API call with valid credentials.
If you are not sure where your activation moment is, run a cohort analysis. Look at which actions correlate most with paid conversion. The actions with the strongest relationship often define your activation event.
What to avoid when choosing activation events:
• Do not choose vanity actions such as “logged in twice”.
• Do not choose actions that users complete without understanding value.
• Do not use events that rely too heavily on marketing pushes rather than product engagement.
Step 2. Identify depth of usage
Activation shows the first value moment. Depth shows sustained engagement. This is the difference between someone who has tried your product and someone who is actively using it.
Depth of usage is measured through thresholds. Choose thresholds that reflect meaningful progress.
Examples:
• Number of projects created
• Number of team members added
• Number of messages sent
• Number of analytics dashboards created
• Number of files uploaded
• Number of API requests over time
• Frequency of use within the first 14 days
Not every activated user becomes a PQL. Many activate once but never progress. Depth signals adoption and intent. It also helps separate casual testers from users who are genuinely moving toward paid conversion.
How to find the right thresholds: Look at your best customers and identify which usage patterns they share. You will often see natural breakpoints where engaged users cluster. These patterns help you define your depth criteria.
Step 3. Combine fit and behaviour
A PQL is strongest when fit and behaviour are combined.
Fit signals are usually static. Role, industry, company size and problem type rarely change. Behaviour is dynamic and shows what users actually do in the product.
When you combine both, you get a more accurate definition.
Examples:
• A mid market company using your product daily with three team members added is usually a strong PQL.
• A student testing your product with high usage might not be a good PQL if your ICP is B2B.
• A perfect ICP match with low usage is not a PQL yet. They need to reach the value moment first.
Fit signals to consider:
• Industry
• Role or persona
• Company size
• Team structure
• Key pain points
• Use case alignment
• Region or compliance needs
Behaviour signals to consider:
• Activation event completed
• Depth thresholds reached
• Feature usage patterns
• Frequency of use
• Growth in adoption within the account
• Collaboration behaviour
Your final PQL definition should be a simple, clear sentence combining both.
Example PQL definition:
“A user from an ICP company who has completed the primary activation event and reached the minimum depth threshold within their first 10 days.”
Tailoring PQL definitions by business model
Different SaaS models require different approaches. A one size fits all PQL definition will limit your accuracy and reduce conversion.
Here is how to adapt your PQL model based on product type.
Self serve SaaS
Self serve products depend heavily on activation quality. Your PQL model should be anchored in behavioural signals such as feature adoption, frequency of use and collaboration.
What matters most:
• Activation speed
• Clear depth thresholds
• Product nudges that guide users to value
• Early team collaboration
Enterprise SaaS
Enterprise SaaS combines product usage with human relationship building. Behaviour still matters, but your sales team must engage at the right time.
What matters most:
• From single user to multi user adoption
• Early signals that multiple roles are engaging
• Integration and security events
• Usage patterns that show team wide value
In enterprise SaaS, the PQL often triggers a sales assisted motion rather than an immediate purchase.
API first products
API based products rely on technical activation and continuous usage. Your PQL should reflect both.
What matters most:
• First successful API calls
• Volume of requests within a defined period
• Stability and error rates
• Integration of the API into a live workflow
Users who integrate your API deeply are highly likely to convert.
Marketplaces
Marketplaces have two sides, and each influences the other. One side often drives the PQL status for the opposite side.
What matters most:
• Listings created
• First successful transaction
• Repeat transaction signals
• Quality metrics such as response time or listing completeness
• Demand or supply liquidity signals
A marketplace PQL is usually any user who has passed the first transaction and engaged in repeated actions.
Linking onboarding and activation to PQL success
Your PQL rate is directly influenced by how quickly and smoothly users reach the value moment. If your onboarding flow is unclear, you will produce fewer PQLs no matter how good your product is.
Why activation drives PQLs
Activation is the first point where value is felt. You cannot have a strong PQL definition without clearly defined activation events.
How to improve onboarding flows
• Map the critical path to your aha moment
• Reduce steps that slow users down
• Use checklists to guide first actions
• Add prompts when users drop off
• Instrument every key step in the funnel
The data and analytics stack you need to track PQLs
You cannot build a reliable PQL model without clean, structured and consistent data. Most companies fail at PQL implementation not because their definition is wrong, but because the underlying data is incomplete or fragmented. This section explains the essential components of a modern analytics stack and how each part contributes to accurate PQL tracking.
At a minimum, you need three layers. A product analytics tool to understand behaviour, a CDP to collect and unify data, and a CRM to activate it across sales and customer teams. When these layers are aligned, you gain a clear picture of which users are reaching value and when they should be considered PQLs.
Product analytics
Product analytics tools such as Amplitude, Mixpanel or Heap give you visibility into what users actually do inside your product. They help you track activation events, depth of usage, feature adoption and frequency patterns.
What strong instrumentation looks like:
• Clear event naming conventions that match your product language
• Minimal but meaningful events
• Properties that give context, such as workspace size or role
• Consistent tracking across platforms (web, mobile, API)
• Dashboards that show activation and retention patterns
Your product analytics tool becomes the foundation of your PQL model. It tells you which user behaviours correlate with conversion and which actions should be part of your PQL criteria.
Events you should always instrument:
• Core activation event
• First time use of key features
• Collaboration actions such as invites
• Setup events such as integrations or imports
• Recurring usage events
• Account level changes such as plan upgrades
Strong event coverage supports better scoring, segmentation and dashboards.
CDP and data warehouse
A customer data platform helps you unify data from multiple sources and pass it to your downstream tools. Segment, Rudderstack and similar platforms ensure that your analytics, marketing automation and CRM all receive the same event data with the same structure.
Why a CDP matters for PQLs:
• It prevents discrepancies between analytics dashboards and CRM records
• It ensures the right events arrive in near real time
• It allows you to enrich events with additional attributes
• It makes it easier to maintain a tracking plan across teams
A data warehouse such as BigQuery or Snowflake can sit behind the CDP to allow deeper reporting, cohort analysis and predictive models. This becomes important when your PQL model grows more advanced and you begin to experiment with scoring or AI driven predictions.
What to route through the CDP:
• Activation events
• Depth and adoption events
• ICP attributes based on enrichment tools
• Billing and subscription data
• Support interactions
• Marketing engagement when relevant
Your CDP is effectively the glue that keeps all systems aligned.
CRM
Your CRM is where PQLs become actionable. Once a user meets your PQL criteria, the CRM should automatically flag them, assign an owner and initiate the next step in the sales or success process.
What the CRM should automate:
• PQL identification and scoring
• Assignment to the right team or rep
• Alerts or notifications for follow up
• Tasks and playbooks based on segment
• Notes that show behavioural context
• Sync back to product analytics for feedback loops
Your CRM becomes the system of record for all customer facing teams. It ensures that when someone becomes a PQL, the right action happens at the right time without manual work.
CRM data fields you should maintain:
• Activation status
• PQL status and timestamp
• Usage depth score
• ICP fit score
• Feature adoption metrics
• Last activity date
• Segment and intent markers
A CRM that is well integrated with product analytics often leads to significantly better follow up quality.
How to measure PQL performance
Once your PQL definition is live, you need to measure what happens next.
Core metrics to measure
• PQL rate
• PQL to Paid conversion
• Time to PQL
• Retention of PQL cohorts
• Activation to PQL ratio
Cohort analysis
Track how PQL rates evolve over time and across segments. This shows whether your onboarding or product changes are improving value discovery.
Dashboards you should maintain
• Weekly PQL volume
• PQL funnel performance
• Segment level performance by industry or plan
• PQL health by cohort
How to prioritize and score PQLs
Not all PQLs carry the same value. Some users match your ICP perfectly and show strong engagement patterns. Others reach activation but are not a good long term fit. Prioritization helps your sales and product teams focus on the leads most likely to convert and retain.
Scoring PQLs also prevents your teams from wasting time on users who look active but will not generate meaningful revenue. A repeatable scoring model ensures every PQL flows to the right follow up path.
Scoring model
Your scoring model should include two components. Fit score and usage score. Together, they give you a simple and accurate way to determine which PQLs deserve priority.
Fit score
The fit score shows how closely a user or account matches your ideal customer profile. It is usually based on static or demographic attributes.
Common fit criteria include:
• Industry alignment
• Company size or revenue band
• Team structure
• Role or seniority of the buyer
• Technology stack compatibility
• Problem fit and urgency
• Region and compliance requirements
A strong fit score means the account is likely to convert and stay long term.
Usage score
The usage score measures behavioural depth. It shows how engaged the user is and how close they are to the value moment.
Common usage signals include:
• Completion of the activation event
• Repeated use of primary features
• Use of sticky or high value features
• Collaboration behaviour such as invites
• Integration or workflow setup
• Frequency and velocity of usage
• Growth in usage over time
Usage scores move dynamically. As users engage more, their usage score increases. This dynamic nature makes usage score a powerful indicator of intent.
Segmenting PQLs
Once you assign fit and usage scores, you can place PQLs into simple and highly effective segments. These segments guide your follow up strategy.
High fit and high usage:
This is your strongest segment. These users understand your product, match your ICP and show clear intent. They should receive immediate follow up. For self serve products, this may include in app prompts to upgrade or limited time offers. For enterprise products, this may trigger proactive sales outreach with relevant context.
High fit and low usage
These users are a good match but have not yet reached the value moment. They need product led guidance. Nudges, onboarding sessions, educational content and clear next steps help them reach activation. Sales should not intervene too early, because premature outreach often creates friction.
Low fit and high usage
These users are engaged but may not be suitable long term customers. They might use the product heavily for personal or niche reasons. Treat them with a lighter touch. Automated education and support material may work better than manual outreach. You can still encourage conversion, but with realistic expectations about retention.
Low fit and low usage
This group contributes the least value. They typically explore the product but do not progress. They are not a priority for sales. Automated nurturing or product improvements targeted at early user experience may be more effective. These users can still provide insights into onboarding friction.

Why segmentation matters
Segmentation prevents a one size fits all follow up motion. It ensures high intent users get timely help while lower value segments receive efficient, automated pathways.
It also helps your product team understand which users are reaching value and where they are getting stuck. When you notice that a large number of high fit users remain low usage, it often signals onboarding friction or unclear product value.
How to operationalize segmentation:
• Add scoring fields directly into your CRM
• Create automated routing rules for each segment
• Build playbooks tailored to each segment’s behaviour and fit
• Create dashboards that show how each segment converts
• Review segment performance weekly to refine thresholds
Prioritization is not only a sales function. It is also a feedback loop for product and growth teams.
Cross functional PQL operations
PQLs only work when the entire company behaves like one system. Defining the PQL is the easy part. Operationalizing it across product, marketing, sales and customer success is where most companies fail. Misalignment creates slow follow ups, inconsistent messaging and lost opportunities. A clear cross functional model solves this.
Strong PQL operations give every team shared visibility into user behaviour, shared definitions of value and shared responsibility for revenue outcomes. When each team understands its role, PQLs become a reliable growth lever instead of an internal debate.
What alignment looks like
Product
Product is responsible for identifying what signals matter. This includes activation metrics, depth thresholds and event definitions. Product also ensures the instrumentation is clean and that analytics reflect real user behaviour. Product becomes the source of truth for value creation and the architect of the data foundation behind PQLs.
Marketing
Marketing owns top of funnel quality and ICP alignment. They attract the right users so the PQL model is not polluted with unfit signups. Marketing also shapes the onboarding experience through content, in app messaging and lifecycle campaigns. Their work helps users reach activation faster, which increases PQL volume and quality.
Sales
Sales engages only when behaviour shows clear intent. They receive PQLs with full context such as usage history, ICP match and activation events. This creates meaningful conversations instead of cold outreach. Sales focuses on helping users deepen value, navigate pricing and make smarter decisions. They should always bring product led context to every interaction.
Customer success
Customer success owns long term value. They ensure that converted PQLs remain active, achieve their goals and expand within the product. CS also feeds insights back into product and marketing about what behaviours predict retention and which segments need better activation or education.
Processes to define
• Clear handoff points
• SLA for PQL follow up
• PQL definition governance
• Quarterly review of funnel and definitions
ROI and business case for PQL implementation
Strong PQL definitions lead to better revenue results.
How to model the impact
• Baseline your current trial to paid conversion
• Model the uplift from improved activation
• Model the increase in PQL to Paid conversion
• Estimate the impact on MRR and ARR
• Factor in CAC savings from fewer unqualified leads
A 10 to 20 percent uplift in PQL related conversion can create a large revenue impact for growth stage SaaS companies.
Future of product qualified leads
PQLs are evolving quickly as product data becomes richer and AI models improve.
Trends to watch:
• Predictive scoring based on behavioural patterns
• AI powered next best action recommendations
• Expansion PQLs that identify accounts ready to upgrade
• Increased automation in onboarding and activation
• Product led sales becoming standard for enterprise SaaS
This is where the next wave of PLG innovation is heading.
PQL implementation checklist
Here is a simple checklist teams can use.
- Define your activation event
- Map the critical path to value
- Identify your usage depth signals
- Identify your ICP fit criteria
- Combine fit and usage into a clear PQL definition
- Instrument essential events
- Build your dashboard
- Align product, sales and marketing on handoffs
- Review PQL performance weekly
- Refine definition quarterly
When to bring in a fractional CPO to improve your PQL strategy
Many companies attempt to implement PQLs without the right foundations. They end up with unclear definitions, messy data and dysfunctional handoffs.
A fractional CPO helps you accelerate the process by bringing clarity, structure and experience.
How a fractional CPO supports your PQL work
• Defines activation events that matter
• Rebuilds your onboarding funnel
• Creates clean tracking plans and event definitions
• Aligns product, sales and marketing around one model
• Builds your PQL scoring system
• Designs your dashboards and metrics
• Improves trial to paid conversion in predictable steps
If your company is struggling with activation, low PQL volume or unclear handoffs, working with a fractional CPO gives you the clarity and system you need.
Get a clear and high performing PQL strategy in weeks, not months. Book a Product Strategy Session with our fractional CPO service.
FAQ’s
Is every free user a PQL?
No. Only users who reach meaningful value inside your product are true PQLs.
How often should we redefine our PQL?
Quarterly is a good cadence because product changes create new paths to value.
Can enterprise SaaS use PQLs?
Yes. Even if you use a sales led motion, behavioural signals can identify high intent accounts.
What if our product does not have a clear activation moment?
You need to run a funnel analysis to find the first action that correlates most with conversion.
Sivan Kadosh is a veteran Chief Product Officer (CPO) and CEO with a distinguished 18-year career in the tech industry. His expertise lies in driving product strategy from vision to execution, having launched multiple industry-disrupting SaaS platforms that have generated hundreds of millions in revenue. Complementing his product leadership, Sivan’s experience as a CEO involved leading companies of up to 300 employees, navigating post-acquisition transitions, and consistently achieving key business goals. He now shares his dual expertise in product and business leadership to help SaaS companies scale effectively.