Product Management Metrics That Actually Drive Growth
November 25, 2025 • 10 min read

Last Updated on November 25, 2025 by Sivan Kadosh
I recently began interviewing CPO candidates for an organization I advise. In these interviews, I ask one key question that reveals almost everything about the candidate:
“Let’s assume you are a pilot, and your product is the plane. What are the routine checks you perform to ensure the plane is flying correctly?”
The answers I receive expose a surprising reality: while this plane has thousands of moving parts, very few candidates insist on consistent monitoring of the dashboard. I believe that a product manager who doesn’t track the numbers is a “theoretical” manager, functioning more as a “technical writer” than a business leader. This is exactly the profound difference Marty Cagan (SVPG) defines between Product Teams and Feature Teams: while the former take ownership of the outcome, the latter merely deliver output.
To fly the plane to its destination, enjoying the view isn’t enough; you must apply a rigorous methodology of measuring product health, as emphasized by Sequoia Capital. A true product manager must navigate by a clear North Star Metric, as taught at Reforge, ensuring every action moves the plane toward its goal. If you don’t know how to read the instruments, when pressure (Churn) rises or fuel (Engagement) runs low, don’t ask to sit in the cockpit.
Key takeaways:
- Product metrics only matter when they connect to strategy and real customer outcomes.
- Your product lifecycle stage should determine which metrics you focus on.
- Different business models require different metric priorities.
- The most valuable metric work is interpretation, not tracking.
- A fractional CPO can set a clear measurement framework that helps teams focus on the right outcomes.
What product management metrics are and why they matter
Product management metrics measure how users experience your product and how those experiences translate into business results. They give product teams a shared language to understand value creation and performance.
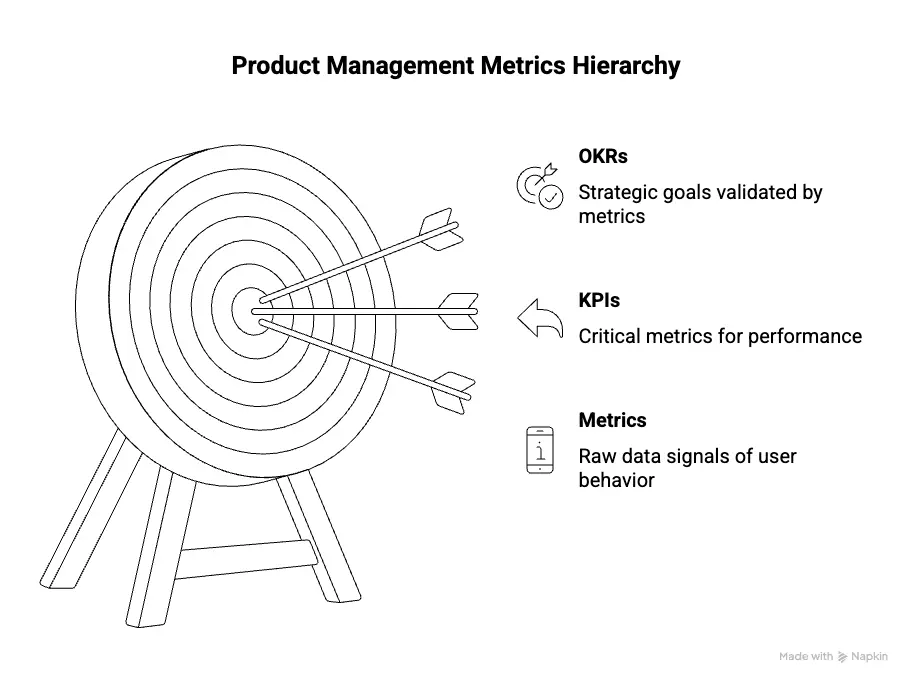
Metrics, KPIs, and OKRs often get blended together, so clarify the hierarchy early.
Metrics are the raw signals. KPIs are the handful of signals designated as critical. OKRs define goals that metrics must validate. When these three align, product teams move faster and with more confidence.
Metrics also help avoid opinion based decision making. Clear data shows whether users complete onboarding, come back regularly, discover new features, or churn. Without these signals, teams may misjudge what to build next or what to fix.
If you need hands on support defining these metrics and turning them into a working operating system, our product management consulting service can help.
Stop guessing. Start calculating.
Access our suite of calculators designed to help SaaS companies make data-driven decisions.
Free tool. No signup required.
Framework for selecting the right metrics
Choosing metrics is easier when you anchor them to product strategy, lifecycle stage, and business model. Most teams track too many numbers, which creates noise. The goal is not to monitor everything. The goal is to monitor what drives movement.
Align metrics with product strategy
Start with your core objective. If your strategy prioritises activation, choose metrics that measure the first moment of value. If your focus is expansion revenue, prioritise adoption of high value features. A good metric directly reflects whether the strategy is working.
Choose metrics based on product lifecycle
Your product stage shapes what matters most.
- Discovery: problem validation, user interviews, early conversion signals
- Launch: activation rate, onboarding completion, time to value
- Growth: engagement depth, feature adoption, retention curves
- Maturity: churn, net dollar retention, unit economics
Each stage has different questions and different success signals.
Decide based on business model
Metrics vary across product categories.
- B2B SaaS: expansion revenue, retention by cohort, user activation
- B2C mobile: DAU, MAU, D1 and D7 retention, session frequency
- Marketplace: liquidity, matching rate, GMV, take rate
- Hardware plus software: attach rate, subscription conversion, usage consistency
This context avoids one size fits all thinking.
A practical decision flow
- Identify your strategic objective
- Determine your product lifecycle stage
- Map your business model and audience
- Select the three to five metrics that reflect the most critical outcomes
The most important product management metrics
Below is a curated set of essential metrics. Each one includes what it measures, why it matters, and what to do if the number shifts.
Acquisition and reach metrics
These metrics help you understand how prospects discover and enter your product.
- Sign up rate
- Website to trial conversion
- Qualified leads or PQLs
- Cost per acquisition
Acquisition metrics matter most in early and growth stages. If they drop, evaluate messaging, positioning, or user intent alignment.
Activation metrics
Activation measures the first meaningful moment a user experiences value.
- Activation rate
- Time to value
- Onboarding completion rate
These metrics reveal how well your onboarding experience works. If activation drops, focus on reducing friction and simplifying the early experience.
Engagement metrics
Engagement shows whether users return and find ongoing value.
- Daily active users
- Monthly active users
- Stickiness ratio (DAU divided by MAU)
- Feature adoption rate
- Session frequency
Low engagement usually signals unclear value, poor feature discoverability, or ineffective onboarding.
Retention and churn metrics
Retention is often the most important metric in product management.
- Customer retention rate
- User retention by cohort
- Churn rate
- Reactivation rate
When retention drops, focus on understanding why users disengage. Look at time to value, depth of feature usage, and customer experience issues.
Revenue and monetisation metrics
These show how product behaviour influences business performance.
- ARR
- MRR
- LTV
- ARPU
- Expansion revenue
- Net dollar retention
If revenue metrics flatten, review pricing, value messaging, and adoption of premium features.
Customer experience metrics
Quantitative metrics tell part of the story. Experience metrics fill the gaps.
- NPS
- CSAT
- CES
- User sentiment analysis
Combine these with behavioural metrics to get a full picture.
| Metric | Formula | Purpose | Owner | Example Interpretation |
|---|---|---|---|---|
| NPS | (% Promoters minus % Detractors) times 100 | Measures loyalty and overall satisfaction | Product or Customer Success | A score of 45 shows strong loyalty, but rising detractors reveal friction |
| CSAT | Satisfied responses divided by total responses | Measures satisfaction with a specific part of the experience | Customer Success | CSAT of 82 percent after onboarding indicates a healthy first time experience |
| CES | Average rating of effort required for a task | Shows how easy or difficult core actions feel | Product or UX | A low CES for creating a project means the flow feels intuitive |
| User sentiment analysis | Automated scoring of qualitative feedback | Reveals emotional tone behind support tickets or feedback | Product, Support, Research | Negative sentiment rising after a release highlights hidden pain points |
How metrics evolve through the product lifecycle
Metrics are not static. Your focus should shift as your product matures.
Metrics for early stage and launch
At this stage, activation, onboarding, and time to value matter most. These metrics confirm if your product solves a real problem and if users can reach value quickly.
Metrics for growth stage
As traction improves, you need deeper insights into engagement and retention. Feature adoption and stickiness become leading indicators of future revenue.
Metrics for maturity
Mature products focus on efficiency and expansion. Churn, NDR, and unit economics reveal whether the product can scale sustainably.
| Stage | What Matters | Why It Matters | Example Signals |
|---|---|---|---|
| Early stage and launch | Activation, onboarding completion, time to value | Confirms the product solves a real problem and users reach value fast | Users activate within their first session, onboarding drop off is low |
| Growth stage | Engagement, retention, feature adoption, stickiness | Shows whether usage is deepening and if the product is becoming part of the user workflow | Feature adoption climbing, weekly active ratio rising |
| Maturity | Churn, NDR, expansion revenue, unit economics | Indicates if the product can scale efficiently and sustainably | High NDR, low churn, strong expansion revenue |
Business model specific metric recommendations
Different models require different measurement approaches. Avoid forcing SaaS metrics onto non SaaS products or mobile metrics onto enterprise products.
SaaS: Focus on retention, activation, NDR, churn, and expansion revenue.
Mobile app: Prioritise DAU, MAU, session frequency, D1 and D7 retention, and feature usage depth.
Marketplace: Measure liquidity, matching rate, GMV growth, and take rate.
Hardware plus software: Track attach rate, subscription conversion, and ongoing usage quality.
| SaaS | Mobile App | Marketplace | Hardware plus Software |
|---|---|---|---|
| Retention | DAU and MAU | Liquidity | Attach rate |
| Activation | Session frequency | Matching rate | Subscription conversion |
| NDR | D1 and D7 retention | GMV growth | Usage quality |
| Churn | Feature usage depth | Take rate | Ongoing engagement patterns |
| Expansion revenue | Engagement depth | Seller and buyer retention | Recurring revenue consistency |
How to use metrics to guide product decisions
Tracking numbers is not the goal. Acting on them is.
Metric interpretation checklist
For each metric, ask:
- Is this a leading or lagging signal
- What behaviour does it represent
- What customer story does it suggest
- What trade offs might exist
- What experiments will validate the root cause
Common metric trade offs
Many metric changes influence others. Reducing onboarding friction may increase sign ups but hurt activation quality. Increasing stickiness may lower session efficiency. Understanding trade offs prevents local optimisation.
Metrics that guide roadmap decisions
Your roadmap should reflect your most important metric opportunities. If activation is low, invest in onboarding. If expansion revenue is low, focus on power features and upgrade triggers.
Short case example
A B2B SaaS team discovers that activation is strong but retention is weak. After cohort analysis, they see that most churned users never adopted the core collaboration feature. They redesign feature onboarding, run guided tours, and introduce contextual prompts. Retention improves within one quarter.
Tools, dashboards, and how to set up tracking correctly
Data is only useful when it is accurate and accessible. Poor instrumentation leads to bad decisions. Here are my tips:
What to instrument
Focus on key events that represent value, not every possible click. Define events, properties, and consistent naming standards.
Common tools
Amplitude, Mixpanel, GA4, and internal BI dashboards.
Dashboard best practices
Keep dashboards simple and goal oriented. Group metrics by objective. Use colour coding and consistent timeframes.
Governance
Review metric definitions quarterly. Assign ownership for each metric. Maintain a shared metric dictionary.
Advanced metrics and leading indicators
Advanced metrics help predict outcomes rather than simply measure them.
Leading indicators
- Feature usage patterns that correlate with retention
- Time to value improvements
- Customer effort score
- Predictive churn signals
Product health score
A weighted combination of events that reflect value creation, such as completing key workflows or using high value features.
Combining quantitative and qualitative
When numbers move, complement analysis with interviews, surveys, and session recordings.
Common mistakes product teams make with metrics
Avoiding these mistakes often creates more value than adding new metrics:
- Tracking too many metrics
- Using vanity metrics
- Poor segmentation
- Misreading causation
- Not documenting metric definitions
- Not linking metrics to experiments or decisions
A disciplined measurement culture prevents these issues.
How a fractional CPO elevates product metric strategy
Metrics become more powerful when guided by an experienced product leader. A fractional CPO helps you build a measurement system that aligns with strategy, supports faster decisions, and avoids common pitfalls.
They help teams:
- Identify the right north star metrics
- Choose realistic KPIs
- Build dashboards that highlight true performance
- Connect metrics to roadmap priorities
- Establish review cadences and governance
- Coach teams to interpret signals accurately
If your team struggles with metric overload or unclear priorities, fractional leadership provides clarity and direction.
Want expert support defining meaningful product metrics and improving your decision making? A Fractional CPO can help you build a metrics system that supports real product growth. Contact us to learn more.
Conclusion
Product management metrics only create value when they are selected intentionally, tracked accurately, and reviewed consistently. Focus on the numbers that reflect your strategy, your stage, and your business model. Use metrics to guide decisions, not as a dashboard decoration. When your team understands what truly matters, your product becomes more focused and more valuable.
If you want guidance from an experienced product leader who has built scalable metric systems across multiple SaaS and tech companies, consider partnering with a Fractional CPO. The right metric strategy can transform the way your team builds and ships products.
FAQ’s
What are the most important product management metrics to start with?
Most teams begin with activation, retention, engagement depth, and customer feedback metrics. These give a clear signal of whether users understand the product, return to it, and find value.
How often should product teams review their metrics?
Weekly reviews work best for fast moving teams, with monthly deep dives for trends and quarterly reviews for strategic resets. The key is to keep the cadence consistent.
What is the difference between activation and engagement metrics?
Activation measures whether users reach an early moment of value, while engagement tracks how deeply and frequently they interact with the product over time.
Which metrics indicate product market fit?
Strong retention, high engagement, repeated usage without prompting, and positive sentiment are the clearest signs. If users come back on their own, you are close to product market fit.
How do you pick the right metrics for your product stage?
Early products prioritise activation and time to value, growth stage products focus on adoption and retention, and mature products track churn, NDR, and expansion efficiency.
Should all product teams track the same metrics?
No. Metrics depend heavily on business model, product type, and customer behaviour. SaaS, mobile apps, marketplaces, and hardware each require different measurement frameworks.

Sivan Kadosh is a veteran Chief Product Officer (CPO) and CEO with a distinguished 18-year career in the tech industry. His expertise lies in driving product strategy from vision to execution, having launched multiple industry-disrupting SaaS platforms that have generated hundreds of millions in revenue. Complementing his product leadership, Sivan’s experience as a CEO involved leading companies of up to 300 employees, navigating post-acquisition transitions, and consistently achieving key business goals. He now shares his dual expertise in product and business leadership to help SaaS companies scale effectively.